 |
Unplugged Viz
High-performance scientific visualization isn't just for the workstation anymore
|
 |
Unplugged Viz
High-performance scientific visualization isn't just for the workstation anymore
|
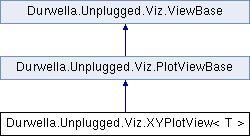
A 2-dimensional plot. The area under (or to the left of) the plotted data is filled in with a color map representing the value. More...
Static Public Attributes | |
| static readonly BindableProperty | DataProperty |
| BindableProperty for the Data property. More... | |
| static readonly new BindableProperty | DataRangeProperty |
| BindableProperty for the DataRange property. More... | |
| static readonly BindableProperty | IsHorizontalProperty |
| BindableProperty for the IsHorizontal property. More... | |
| static readonly BindableProperty | IsBarChartProperty |
| BindableProperty for the IsBarChart property. More... | |
 Static Public Attributes inherited from Durwella.Unplugged.Viz.PlotViewBase Static Public Attributes inherited from Durwella.Unplugged.Viz.PlotViewBase | |
| static readonly BindableProperty | DataRangeProperty |
| BindableProperty for the Data property. More... | |
| static readonly BindableProperty | ColorMapProperty |
| BindableProperty for the ColorMap property. More... | |
| static readonly BindableProperty | ColorMapRangeProperty |
| BindableProperty for the ColorMapRange property. More... | |
| static readonly BindableProperty | ColorMapMinimumProperty |
| BindableProperty for the minimum value of the ColorMapRange property. More... | |
| static readonly BindableProperty | ColorMapMaximumProperty |
| BindableProperty for the maximum value of the ColorMapRange property. More... | |
Properties | |
| new T[] | Data [get, set] |
| Gets or sets a 1-dimensional data array of bytes, ints, or floats. More... | |
| new RangeF | DataRange [get, set] |
| A RangeF defining the numeric values of the independent axis. More... | |
| bool | IsHorizontal [get, set] |
| Determines whether the plot is horizontal (i.e. the x-axis is the independent axis) or not (the y-axis is the independent axis). More... | |
| bool | IsBarChart [get, set] |
| Determines whether the plot is a bar chart or not More... | |
 Properties inherited from Durwella.Unplugged.Viz.PlotViewBase Properties inherited from Durwella.Unplugged.Viz.PlotViewBase | |
| virtual IEnumerable | Data [get, set] |
| Gets or sets a data array. More... | |
| IEnumerable | ScaledData [get, set] |
| The Data, scaled into an array of bytes using the ColorMapRange More... | |
| ShapeFBase | DataRange [get, set] |
| An ShapeFBase defining the numeric values of the horizontal and vertical axes. More... | |
| RectangleF | ViewRectangle [get, set] |
| A RectangleF defining the portion of data actually visible, More... | |
| Color[] | ColorMap [get, set] |
| An array of Colors defining how the data are displayed. More... | |
Additional Inherited Members | |
 Public Member Functions inherited from Durwella.Unplugged.Viz.ViewBase Public Member Functions inherited from Durwella.Unplugged.Viz.ViewBase | |
| void | Update () |
| Update the ViewRender that is rendering this view. More... | |
A 2-dimensional plot. The area under (or to the left of) the plotted data is filled in with a color map representing the value.

|
static |
BindableProperty for the Data property.
|
static |
BindableProperty for the DataRange property.
|
static |
BindableProperty for the IsBarChart property.
|
static |
BindableProperty for the IsHorizontal property.
|
getset |
Gets or sets a 1-dimensional data array of bytes, ints, or floats.
|
getset |
|
getset |
Determines whether the plot is a bar chart or not
Is the plot a bar chart?
|
getset |
Determines whether the plot is horizontal (i.e. the x-axis is the independent axis) or not (the y-axis is the independent axis).
Is the plot horizontal?